A-Grade Corporate Bond Yield Curve for Valuing Long-Duration Insurance Contracts
Bond Market Update - November 2020
December 4, 2020

The valuation of long-term insurance policy benefits will shift to a current-market valuation basis for large public companies in 2023, with restated liability figures generally required as of the two prior year-ends.
Current market discount rates will be based on an “upper-medium grade” fixed income yield, which is broadly interpreted to mean A-grade corporate bonds.
In valuing future policy benefits, the new FASB rules further specify that insurers reflect the duration characteristics of the liabilities and use valuation rates that maximize reference to observable bond data.
Constructing an Appropriate A-Grade Bond Portfolio
Adhering to these new standards will generally require an assessment of relevant bond yields across the full range of maturities. The most direct way to reflect market rates will be to develop a complete yield curve from a portfolio of A-grade bonds, applying year-by-year rates developed from that curve to discount future policy benefits.
Constructing a curve from market data requires addressing a number of technical and methodology considerations, including:
- range of credit ratings by different rating agencies
- minimum issue size to ensure credible bond trading/pricing
- inclusion/exclusion/adjustments for bonds with call features and other embedded options
- inclusion/exclusion of private placement, quasi-government and less broadly-traded bonds
- relative quality/appropriateness of pricing sources and timing for end-of-day price measures
- potential curve-fitting approaches, with varying emphasis on tightness of data-fit vs. smoothness
- extrapolation of long-end rates, beyond the range of credible bond data (a critical factor since payments for many insurance products extend well past 30 years).
Ensuring acceptance by auditors will require that the yield curve be comprehensively documented, consistently applied, and develop results closely reflective of current capital markets and market changes across time.
Bond Market Update
To ensure market consistency, it will be helpful to monitor generally available market information such as bond index averages. Any variation in model vs. market results should be evaluated, understood and (presumably) explainable.
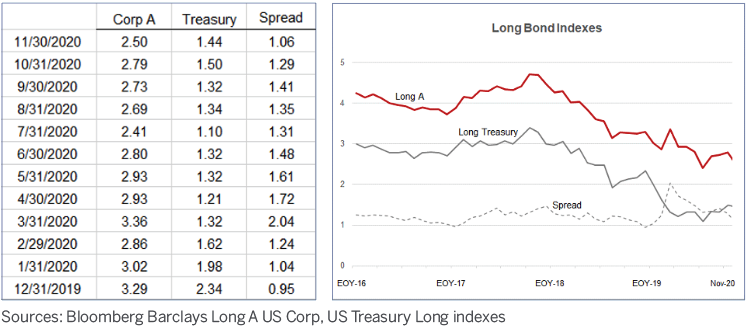
Long bond yields have been on a declining trend for the past two years. Long A-grade corporate yields moved down 79 basis points since the start of the year, while long Treasuries dropped 90 basis points. The reduced rates are to a great extent attributable to adjustments in government monetary policy made in reaction to the Covid-related disruptions to the economy.
Building and Applying a Yield Curve
The following exhibits illustrate the results of an A-grade yield curve model developed as of November 30, 2020.
After filtering the A-grade bond universe for grading, optionality and other factors, the portfolio consists of roughly 2,500 bonds. These are arrayed across maturity groups; a curve is then fit to that array, with a goal of reflecting the mean/median yield for each maturity group. Note that two technical adjustments are made in the course of fitting the curve:
- The fitted curve is modified to the extent necessary to ensure a relatively smooth pattern of yields, with these adjustments very closely controlled to ensure that the overall curve maintains an accurate representation of mean/median yield levels.
- The bonds are characterized, and maturity group averages determined, based on “adjusted” rather than nominal maturities. These adjustments are necessary since the fitted curve is based on a par bond assumption, while few bonds pay coupons at current market rates.* Thus, the bonds are reflected in curve-building at maturity points that align each bond’s actual duration with that of a par bond.

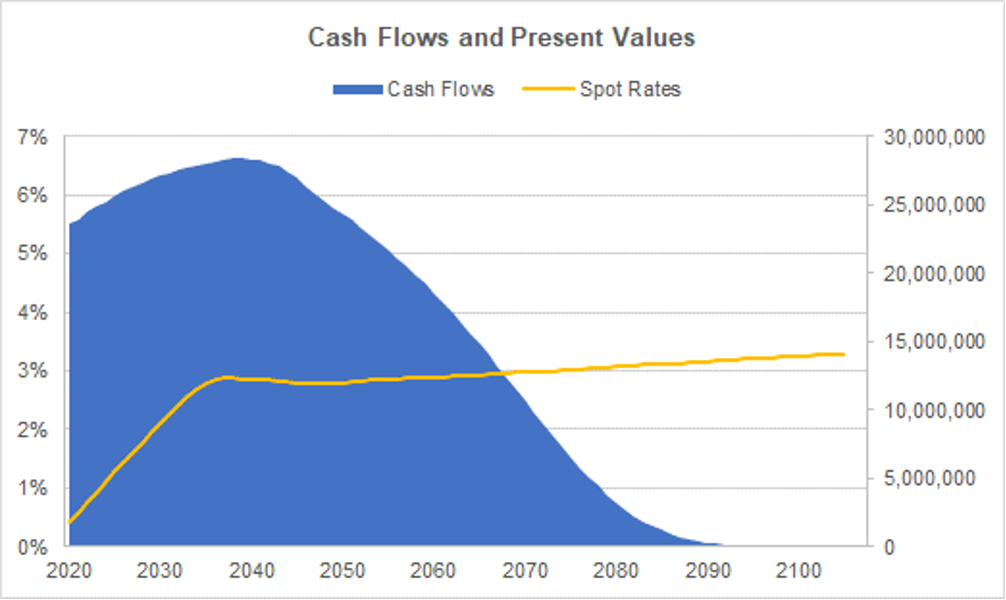
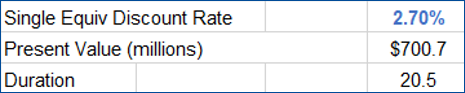
Once yields have been determined at each maturity point, spot rates can be derived (based on a methodology labeled “bootstrapping”). These spot rates are then applied to a given set of projected benefit cash flows, and a present value determined. Often, a flat/single equivalent discount rate consistent with that present value is calculated and used to represent the valuation result.
The example below reflects a very long duration cash flow (e.g., that for a deferred annuity product), along with the application of The Terry Group’s moderate or baseline yield curve:
Variations in Discount Rate Outcomes
Discount rate outcomes almost always vary based on the duration of a given set of benefit cash flows –since the yield curve is almost never totally flat. Another element of variation in outcomes results from the approach taken to extrapolate the curve beyond the maturity point at which the most credible data ends – generally considered to be at about 30 years. The extrapolation impact will of course vary based on the duration of a given cash flow, i.e., for durations of 15 or less there may be little impact.
The Terry Group’s November portfolio includes about 80 bonds with maturities beyond 30 years, and 20 with maturities beyond 40 years. This information, though limited, enables a range of possible extrapolation approaches:
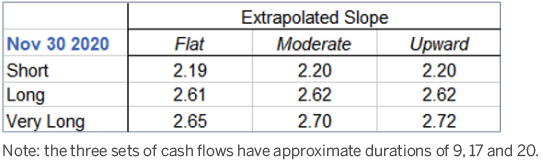
The summarized discount rate outcomes indicate that the dispersion in results based on duration is considerable – there is a range of roughly 50 basis points across our three sample cash flows. This variation in results is especially noteworthy given the current context of a significantly flatter-than-typical yield curve.
The variation in results based on extrapolation approach is less significant, ranging from 1 to 7 basis points depending on duration. (Obviously, cash flow streams with more significant long tails are more affected by the approach used to extrapolate long bond yields.)
You should expect both sources of volatility – related to duration and curve-fitting impacts – to change significantly over time with evolving capital market conditions.
For more information, please contact Jerry Mingione.