A-Grade Corporate Bond Yield Curve for Valuing Long-Duration Insurance Contracts
Bond Market Update – March 2023
April 4, 2023

The valuation of long-term insurance policy benefits is shifting to a current-market valuation basis for large public companies starting this year, with restated liability figures generally required as of the two prior year-ends.
Current market discount rates are based on an “upper-medium grade” fixed income yield, which is broadly interpreted to mean A-grade corporate bonds.
In valuing future policy benefits, the new FASB rules further specify that insurers reflect the duration characteristics of the liabilities and use valuation rates that maximize reference to observable bond data.
Constructing an Appropriate A-Grade Bond Portfolio
Adhering to this standard entails an assessment of relevant bond yields across the full range of maturities. The most direct way to reflect market rates is to develop a complete yield curve from a portfolio of A-grade bonds, applying year-by-year rates developed from that curve to discount future policy benefits.
In constructing a curve from market data a number of technical and methodology considerations must be addressed, including:
- range of credit ratings by different rating agencies
- minimum issue size to ensure credible bond trading/pricing
- inclusion/exclusion/adjustments for bonds with call features and other embedded options
- inclusion/exclusion of private placement, quasi-government and less broadly-traded bonds
- relative quality/appropriateness of pricing sources and timing for end-of-day price measures
- potential curve-fitting approaches, with varying emphasis on tightness of data-fit vs. smoothness
- extrapolation of long-end rates, beyond the range of credible bond data (a critical factor since payments for many insurance products extend well past 30 years).
Ensuring acceptance by auditors requires that the yield curve be comprehensively documented, consistently applied, and provide results closely reflective of current capital markets and market changes across time.
Bond Market Update
Monitoring generally available market information such as bond index averages is necessary to ensure market consistency. Any variation in model vs. market results should be evaluated and rationalized.
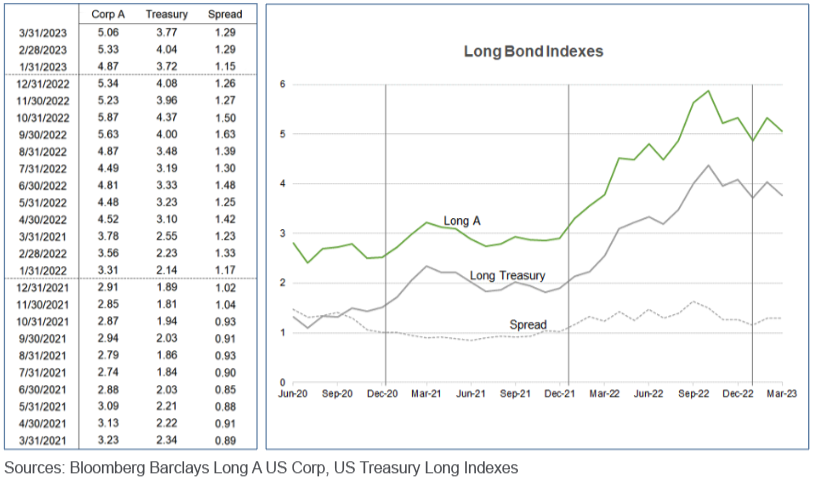
Long bond yields declined almost 30 basis points in March. Long corporate rates are now roughly 80 basis points below their recent peak in October.
The fixed income environment has, of course, been strongly affected by the shift in monetary policy aimed at dampening inflation expectations. The yo-yoing of recent rates is likely indicative of wavering confidence about whether emerging inflation is being constrained, which would enable a relaxation of monetary policy restraints. Corporate rates are further impacted by cyclical vagaries in economic activity and the resulting demand for capital funds.
Building and Applying a Yield Curve
The following exhibits illustrate the results of an A-grade yield curve model developed as of March 31, 2023.
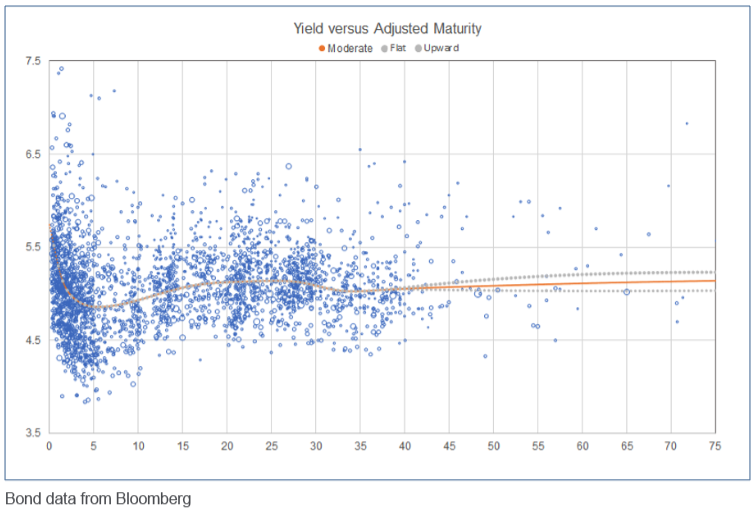
After filtering the A-grade bond universe for grading, optionality and other factors, the portfolio consists of almost 3,000 bonds. These are arrayed across maturity groups; a curve is then fit to that array, with a goal of reflecting the mean/median yield for each maturity group. Note that two technical adjustments are made in the course of fitting the curve:
- The fitted curve is modified to the extent necessary to ensure a relatively smooth pattern of yields, with these adjustments tightly controlled to ensure that the overall curve maintains an accurate representation of mean/median yield levels.
- The bonds are characterized, and maturity group averages determined, based on “adjusted” rather than nominal maturities. These adjustments are necessary since the fitted curve is based on a par bond assumption, while few bonds pay coupons at current market rates.* Thus, bonds are reflected in curve-building at maturity points that align each bond’s actual duration with that of a par bond.
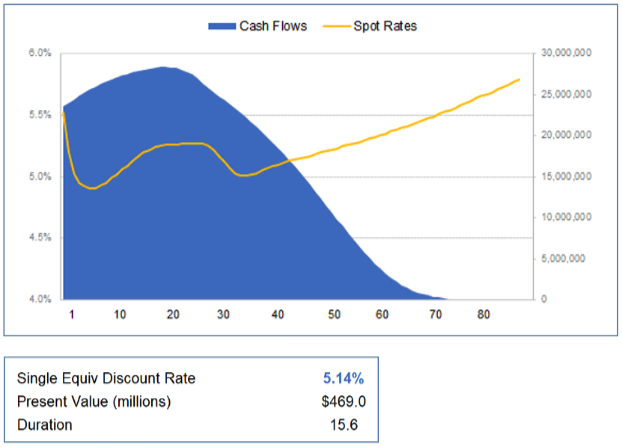
Once yields have been determined at each maturity point, spot rates can be derived (based on a methodology termed “bootstrapping”). These spot rates are then applied to a given set of projected benefit cash flows, and a present value determined. Often, a flat/single equivalent discount rate consistent with that present value is calculated and used to represent the valuation result.
The example below reflects a very long duration cash flow (e.g., that for a deferred income annuity), along with the application of The Terry Group’s moderate or baseline yield curve:
Variations in Discount Rate Outcomes
Discount rate outcomes almost always vary based on the duration of a given set of benefit cash flows—since the yield curve is almost never totally flat. Another element of variation in outcomes results from the approach taken to extrapolate the curve beyond the maturity point at which the most credible data ends—generally considered to be at about 30 years. The extrapolation impact will of course vary based on the duration of a given cash flow, i.e., for durations below 12 there will generally be little impact.
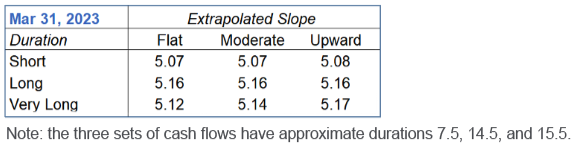
The Terry Group’s March portfolio includes roughly 450 bonds with adjusted maturities beyond 30 years, roughly 100 of which have adjusted maturities beyond 40 years. This information enables a fairly robust curve build beyond the typical 30-year credibility boundary:
March discount rate outcomes declined by about 30 basis points, roughly aligned with bond index results. Recent months’ discount rate results have also indicated two rather atypical patterns that have significantly changed the nature of the curve build:
- Recent periods’ rate increases have pushed market yields ahead of typical bond coupons; for the longest bonds average yields now exceed average coupons by roughly 1.0%. This means that the typical bond at a given maturity point, with a coupon below the market yield, will have a longer duration than the par bonds represented on the curve at that maturity point. Thus, based on our “adjusted maturity” approach, these bonds are represented as par bonds at longer maturities that align with each bond’s calculated duration. This results in a curve build that has become more credible at longer maturity points.
- March yields are essentially flat across the maturity spectrum. A slight rate trough occurs in the 30–40 year maturity range, which much diminishes the scope of any extrapolated upward slope at the long end. The flat yield pattern likely indicates a market expectation that the current high-rate period will be short-lived. (In other words, whatever term premium would normally be expected is being outweighed by an expectation of declining future yields.)
The summarized discount rate outcomes indicate that the variation in results based on duration is very significantly dampened—there is a range of only 9 basis points across our three sample cash flows for March, a small fraction of the typical dispersion across durations.
The variation in results based on the choice of extrapolation approach is much suppressed given the flat yield pattern, with a maximum range of only 5 basis points for the longest set of cash flows. In comparison, results from the December 2021 model showed variations up to 15 basis points.
You should expect both sources of volatility—related to duration and curve-fitting impacts—to change significantly over time with evolving capital market conditions.
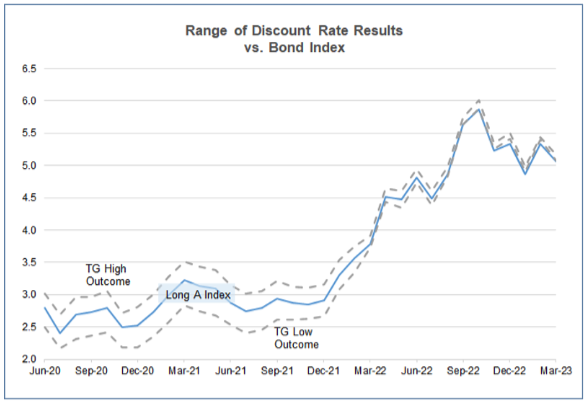
The following graph shows the range of model results over the period since The Terry Group’s yield curve model was initiated in June 2020. Over time, the variations in discount rate outcomes for our sample cash flows, encompassing variations in both cash flow duration and model/slope, have generally resulted in a range of about 50–60 basis points, roughly centered around the index average yield. As the graph illustrates, these relationships were significantly disrupted roughly a year ago by the emergence of a flatter sloped and eventually humped curve pattern.
For more information, please contact Jerry Mingione.

[ninja_form id=2]
Previous Bond Market Updates
February 2023
January 2023
December 2022
November 2022
October 2022
September 2022
August 2022
July 2022
June 2022
May 2022
April 2022
March 2022
February 2022
January 2022
December 2021
November 2021
October 2021
September 2021
August 2021
July 2021
June 2021
May 2021
April 2021
March 2021
February 2021
January 2021