Bond Yield Curve for FASB LDTI
Terry Group A-Grade Corporate Bond Yield Curve for Valuing Long-Duration Insurance Contracts
The valuation of long-term insurance contracts will shift to a current-market valuation basis in 2023, with discounting based on an “upper-medium grade” fixed income yield (broadly interpreted to mean A-grade corporate bonds). In valuing future policy benefits, the new FASB rules specify that insurers reflect the duration characteristics of the liabilities and use valuation rates that maximize reference to observable bond data.
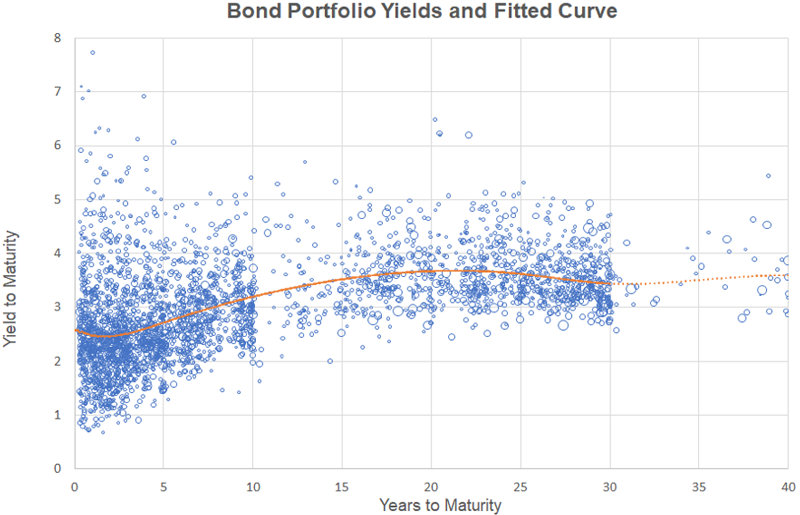
Under these new rules, valuations will refer to an A-graded yield curve developed from a portfolio of current market bonds, applying rates from that curve to discount future policy benefits. Constructing a curve from market data requires addressing a number of technical considerations, including:
- Range of credit ratings by different rating agencies
- Minimum issue size to ensure credible bond trading/pricing
- Inclusion/exclusion/adjustments for bonds with call features and other embedded options
- Inclusion/exclusion of private placement, quasi-government and less broadly-traded bonds
- Relative quality/appropriateness of pricing sources and timing for end-of-day price measures
- Potential curve-fitting approaches, with varying emphasis on tightness of data-fit vs. smoothness
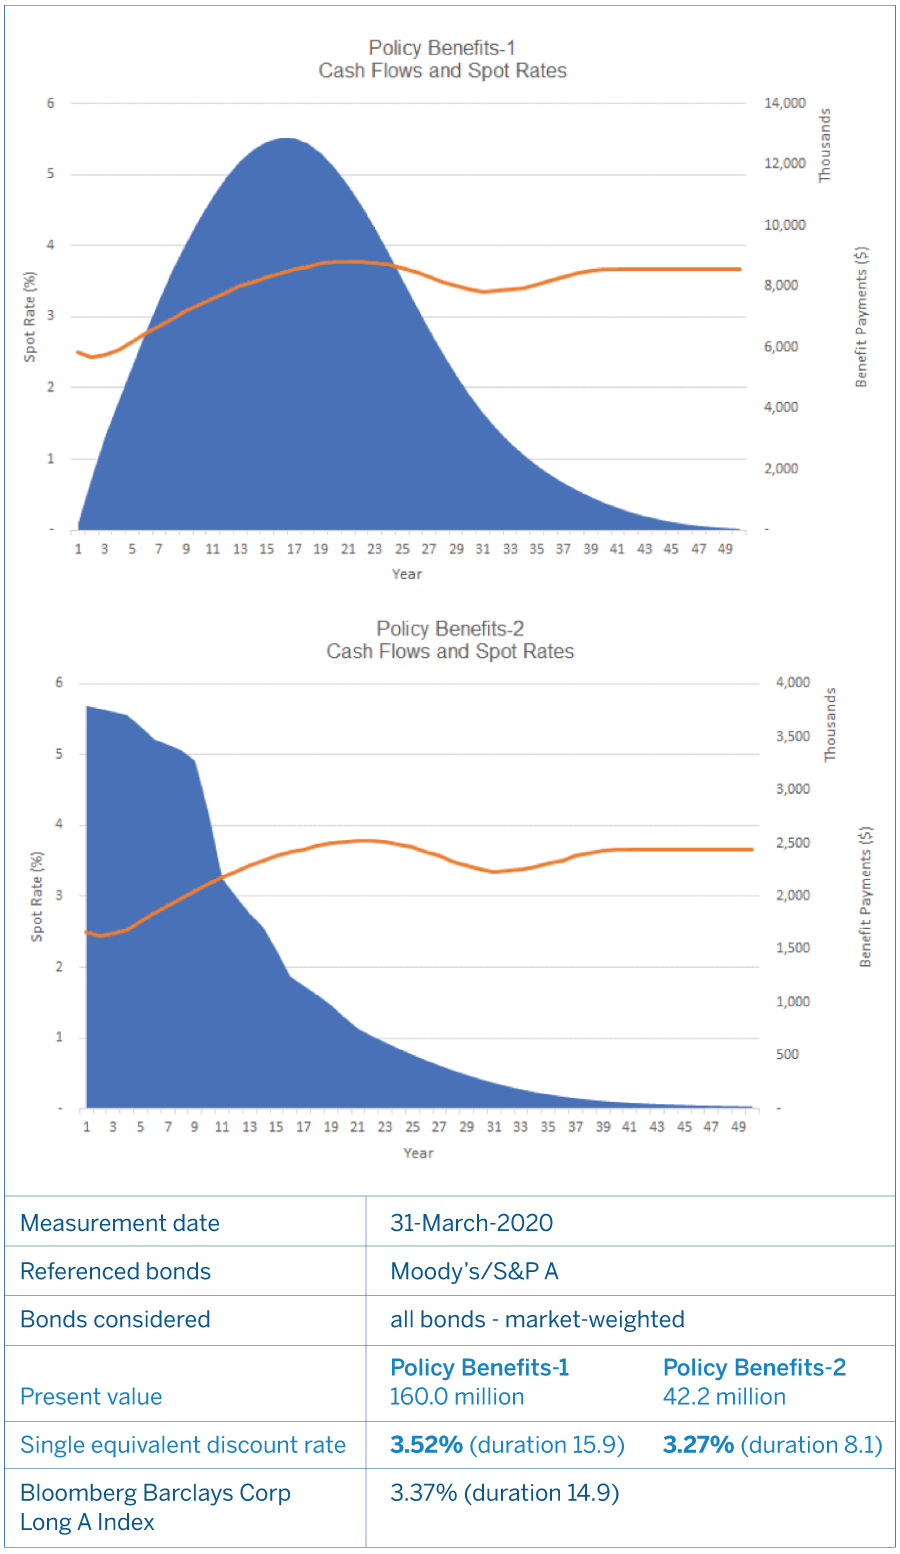
- Extrapolation of long-end rates, beyond the range of credible bond data (a critical factor since payments for many insurance products extend well past 30 years).
Any yield curve methodology will need to be properly documented and consistently applied to ensure acceptance by auditors. In this regard, it will be helpful to be able to “sanity check” a valuation outcome against generally available market information such as bond index averages.
Terry Group staff have extensive experience in developing yield curve applications for pension valuations, and have leveraged this expertise to create a yield curve based on A-graded corporate bonds appropriate for discounting long-duration insurance contracts.
The following graphs and tables illustrate key outcomes and results from this model. Customized versions of the curve can also be made available.


 A-Grade Corporate Bond Yield Curve for Valuing Long-Duration Insurance Contracts